Become one of the cool kids on Github
Data analysis on open source repositories with Scala and Plotly
Pascal Bugnion ![]() @pbugnion
@pbugnion ![]() pbugnion
pbugnion
ASI Data Science is a London-based data science consultancy
About me
- Author of Scala for Data Science (Packt Publishing)
- Main author of jupyter-gmaps, a library for visualizing geographical data in Jupyter notebooks
- Main contributor to Scala Plotly client, which we are developing at ASI
Scala in data science
Scala in data science
One of the most common languages for building large data science applications
- Great native libraries (Akka, Spark)
- Access to everything written for the JVM
Scala in data science
But there is no good data visualization library
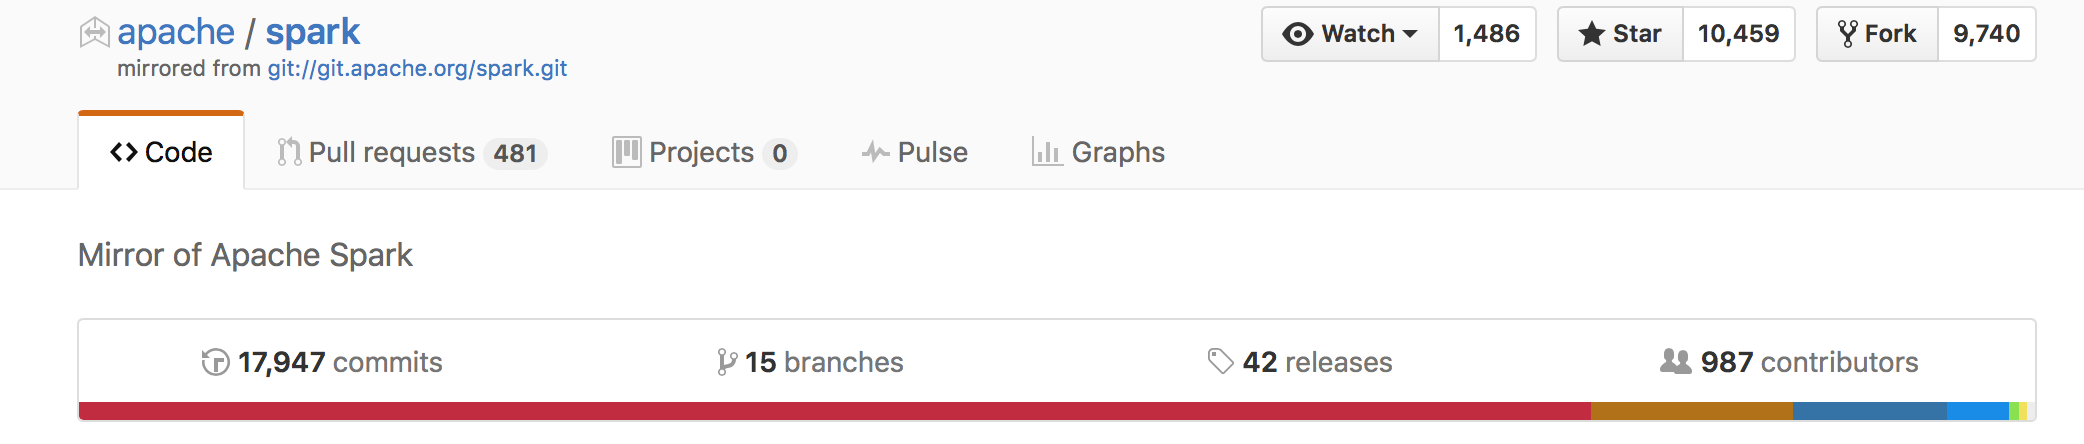
Data visualization libraries are hard to build
Data visualization libraries are hard to build
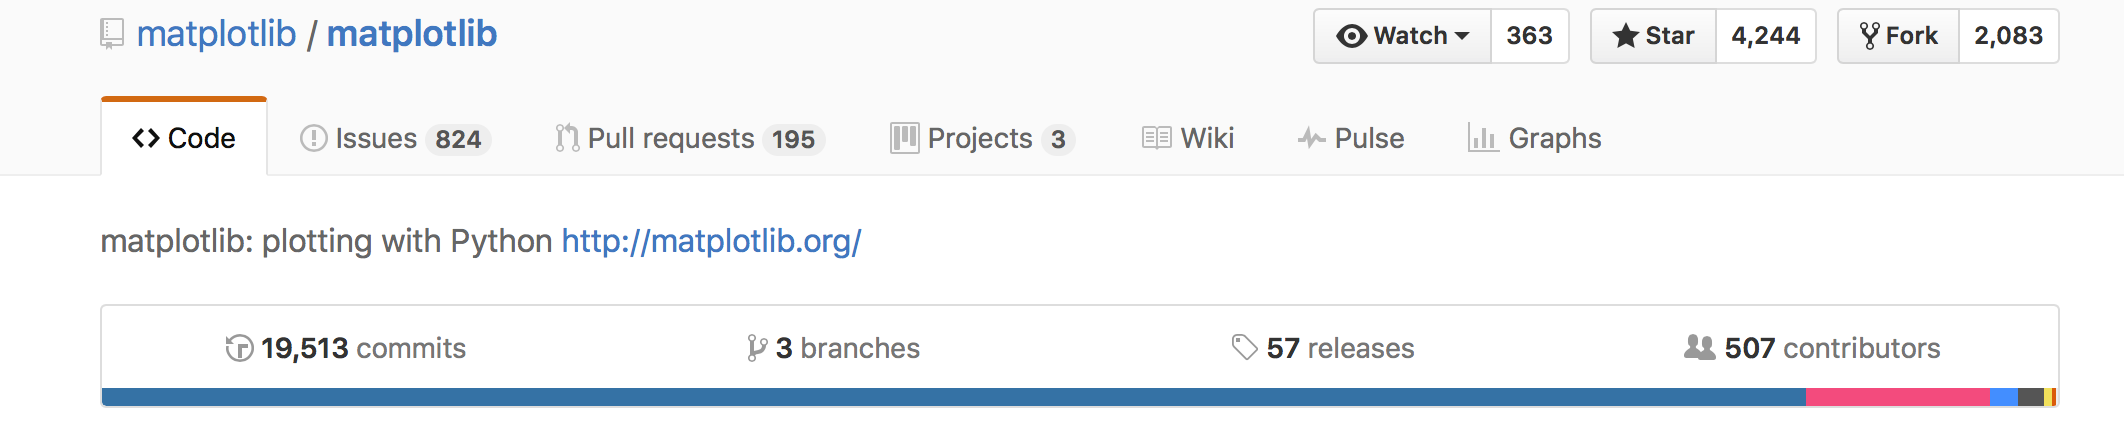
Data visualization libraries are hard to build
Data visualization libraries are hard to build
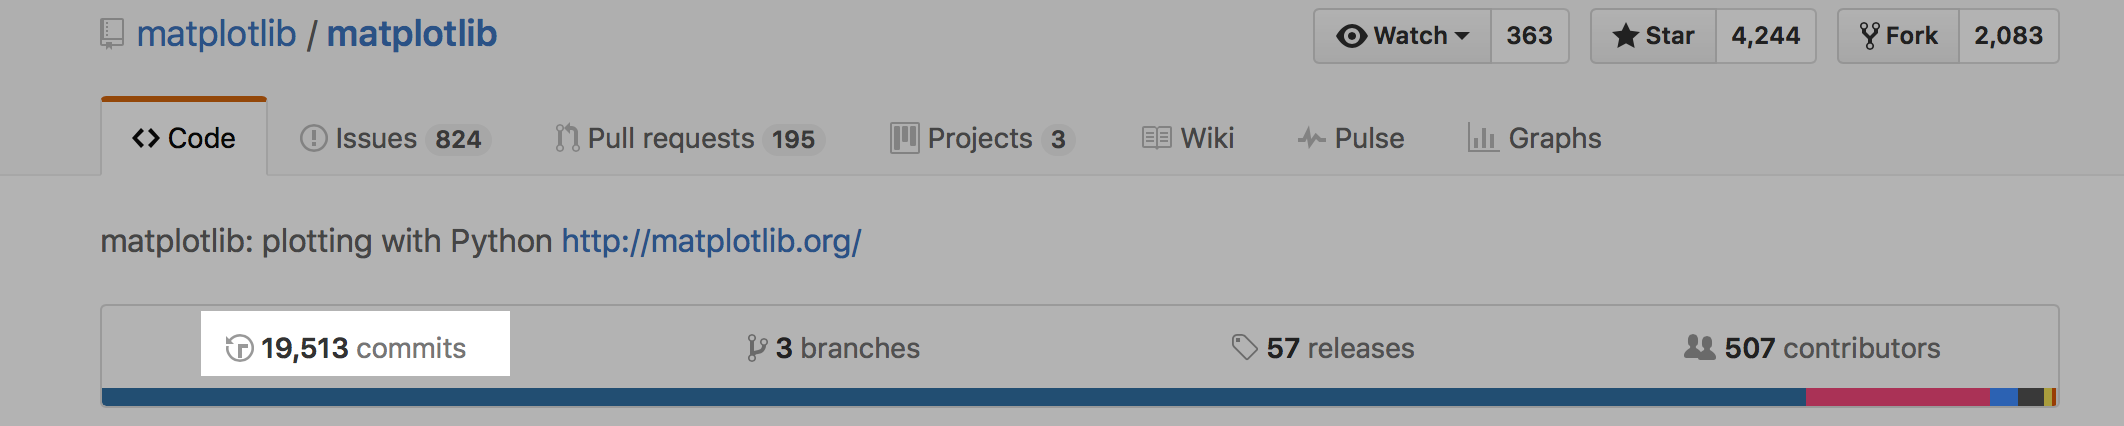
At a conservative two hours per commit, it would take a single person 23 years to build
Data visualization libraries are hard to build
Data visualization libraries are hard to build
- Very good knowledge of the problem domain
- Very good knowledge of the underlying platform
What if we let someone else do all the hard work?
    POST /v1/plot

{
      "data" : {
        "x": ["2016-02-22 18:40", "2016-02-22 19:14", ... ],
        "y": [732.83, 729.65, ... ]
      },
      "figure": {
        "title": "Stock price ($)",
        ...
      }
    }
Plotly clients are easy to build
- We don't need knowledge of the problem domain: we can just rely on Plotly to provide sane defaults
- We don't need to know how to render graphs, just how to generate the right JSON
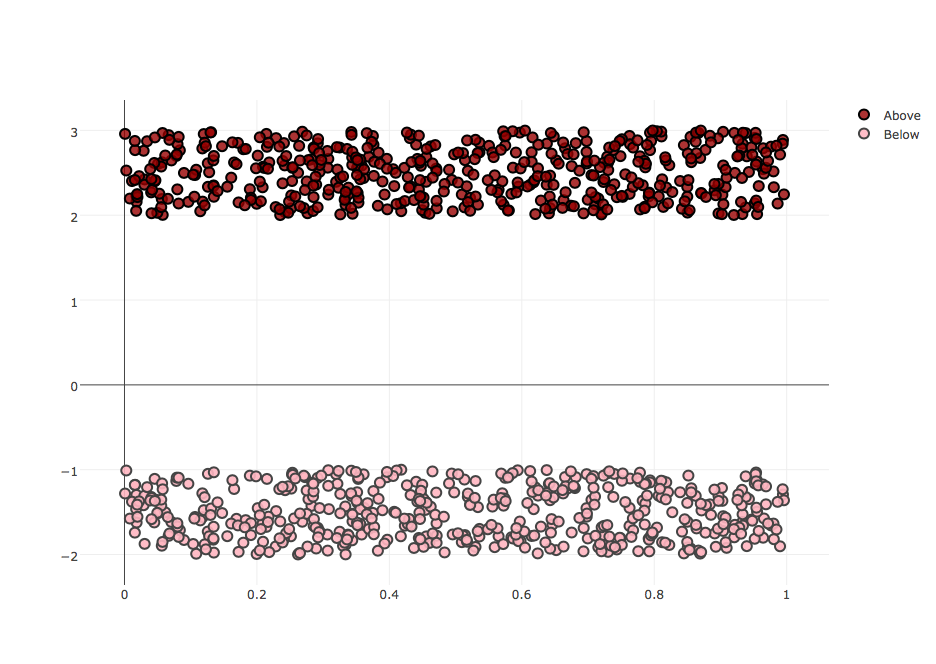
import co.theasi.plotly
import util.Random
// Generate uniformly distributed x
val xs = (0 until 100)
// Generate random y
val ys = xs.map { x => x + 5.0 * Random.nextDouble }
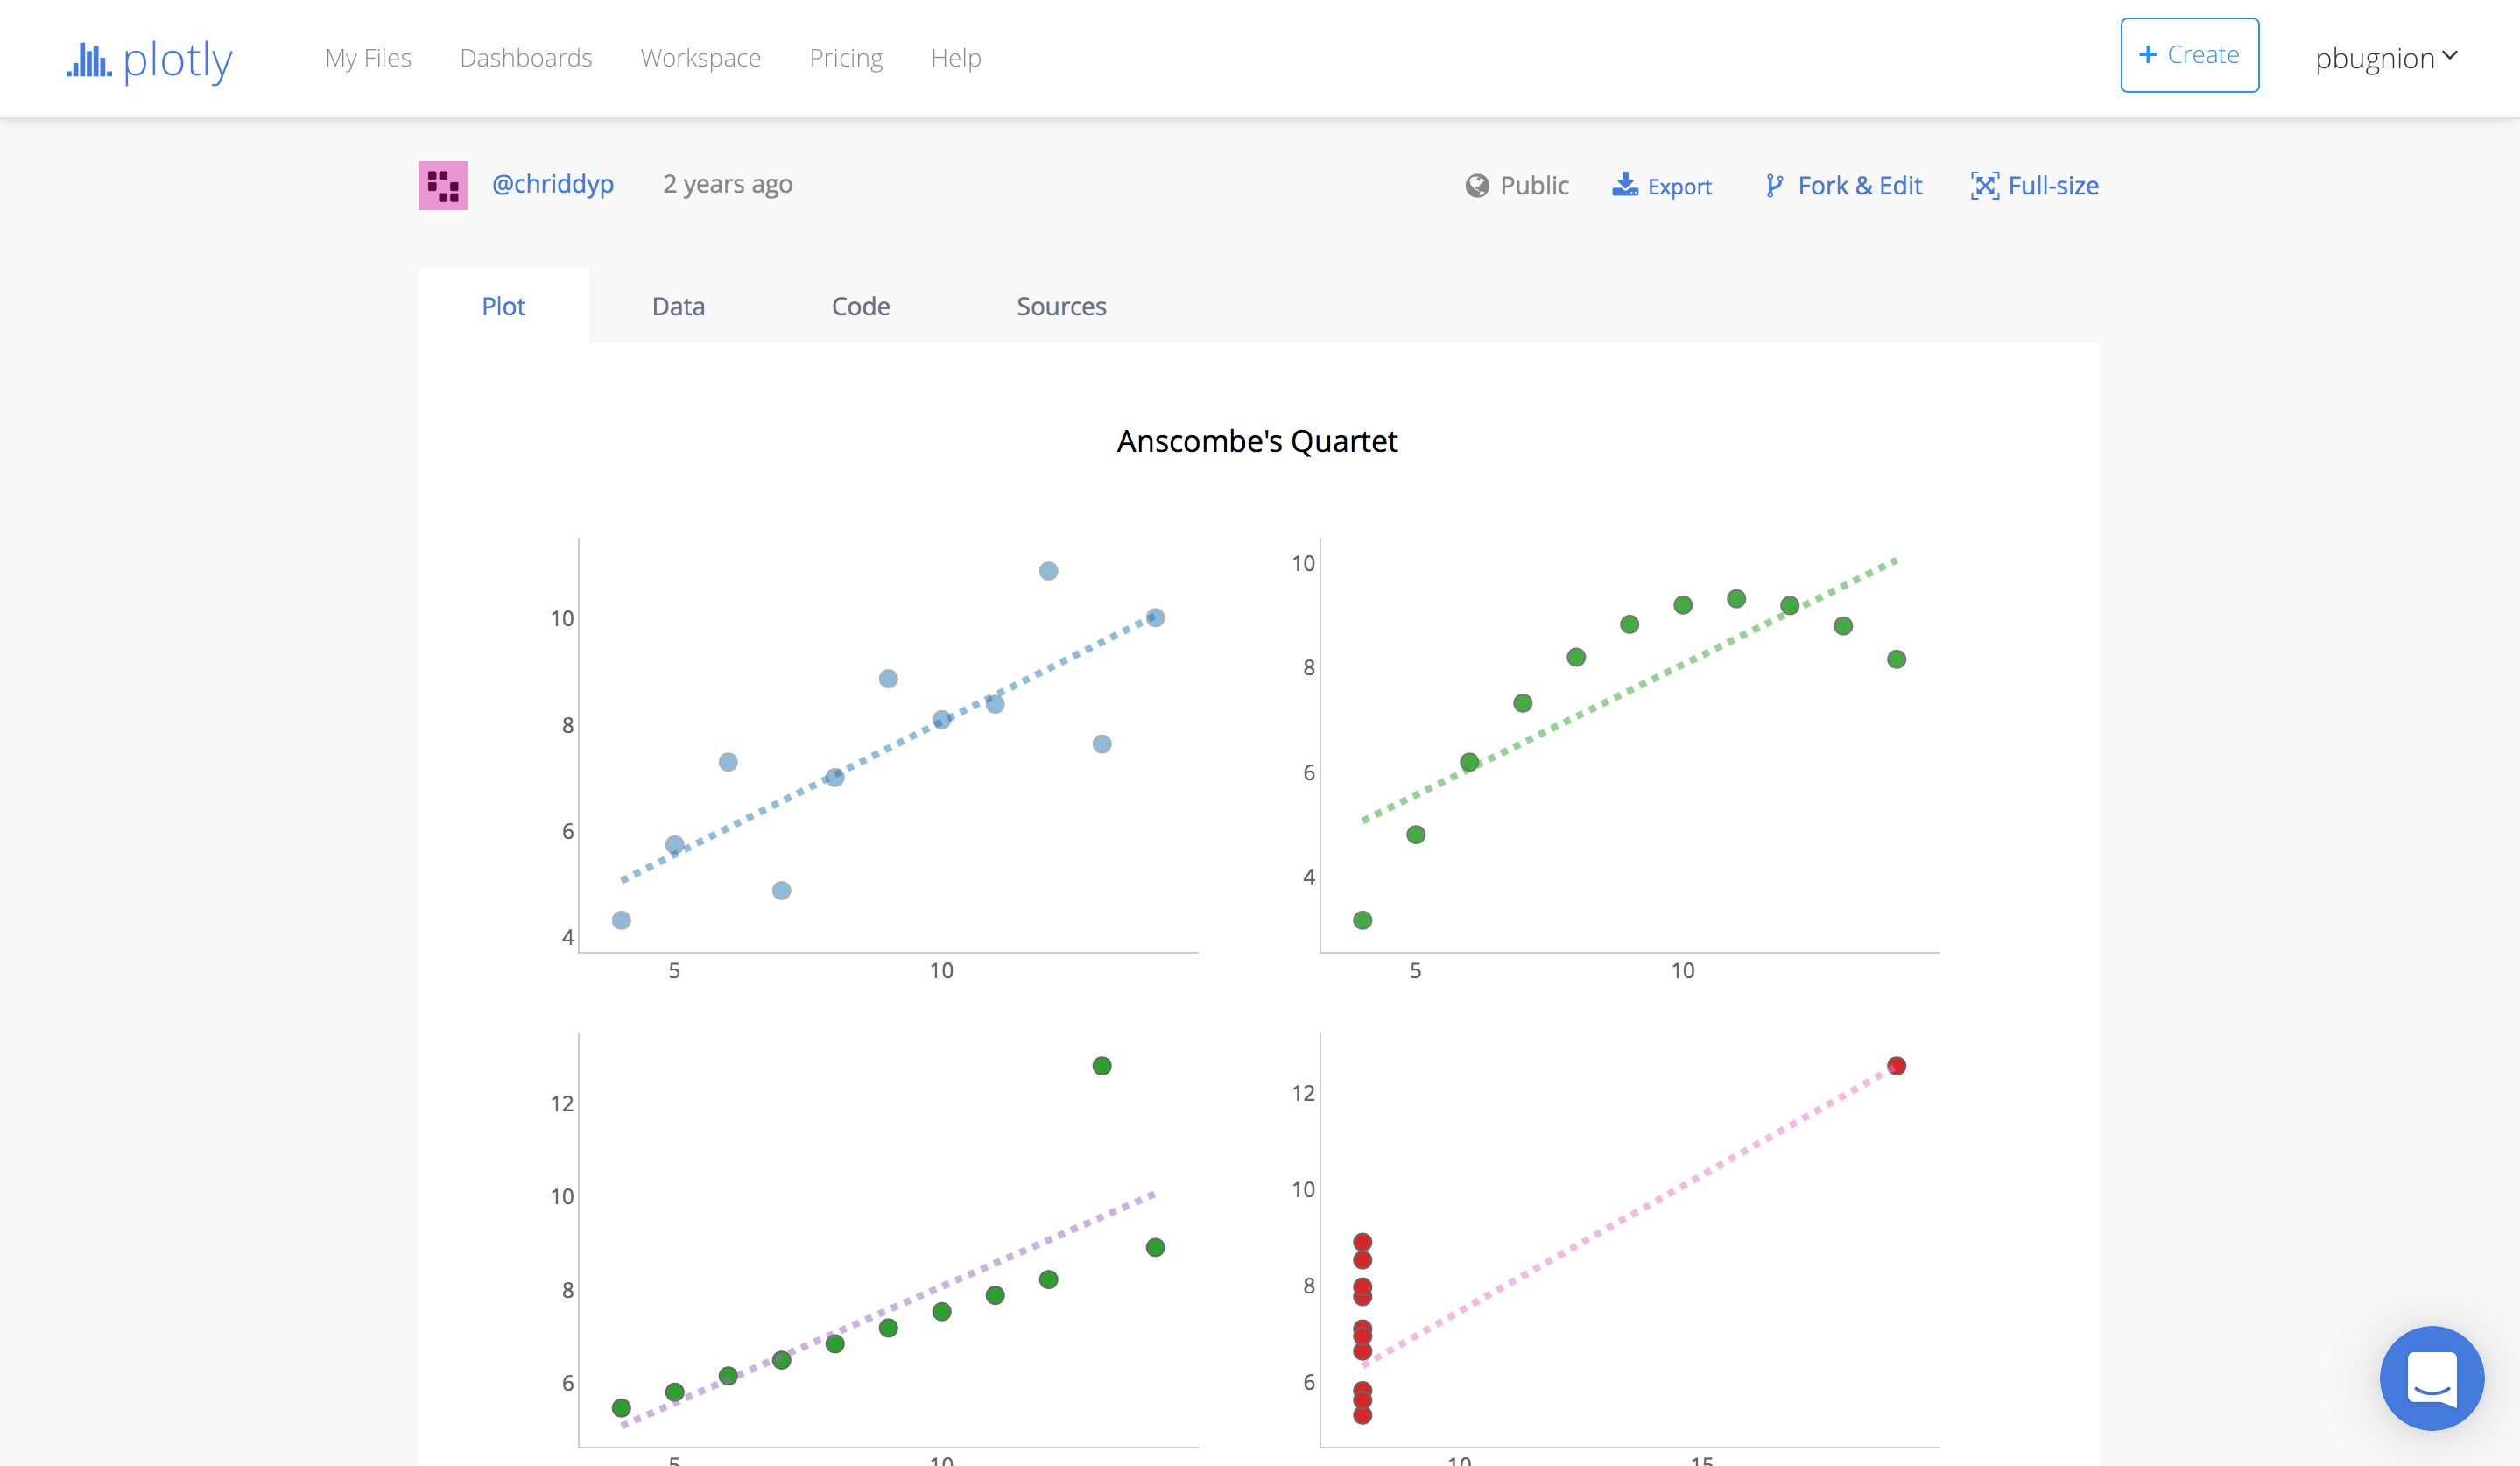
val p = Plot().withScatter(xs, ys)
draw(p, "basic-scatter", writer.FileOptions(overwrite=true))
// returns PlotFile(pbugnion:173,basic-scatter)
import co.theasi.plotly
import util.Random

// Generate uniformly distributed x
val xs = (0 until 100)

// Generate random y
val ys = xs.map { x => x + 5.0 * Random.nextDouble }

val p = Plot().withScatter(xs, ys)

draw(p, "basic-scatter", writer.FileOptions(overwrite=true))
// returns  PlotFile(pbugnion:173,basic-scatter)
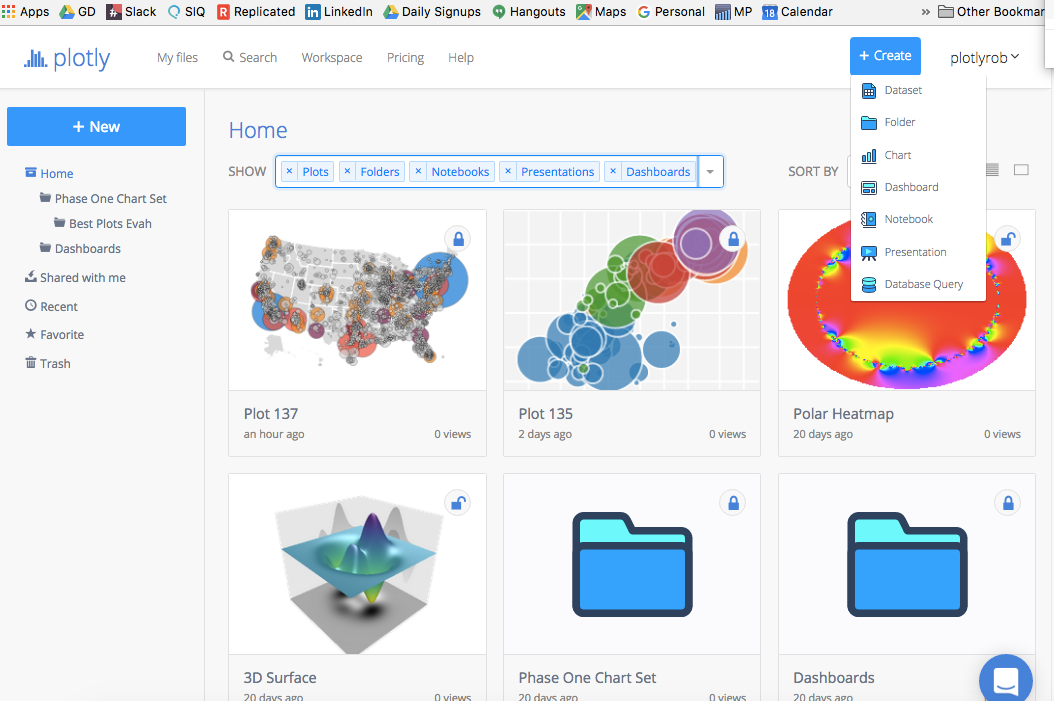
Come and contribute!
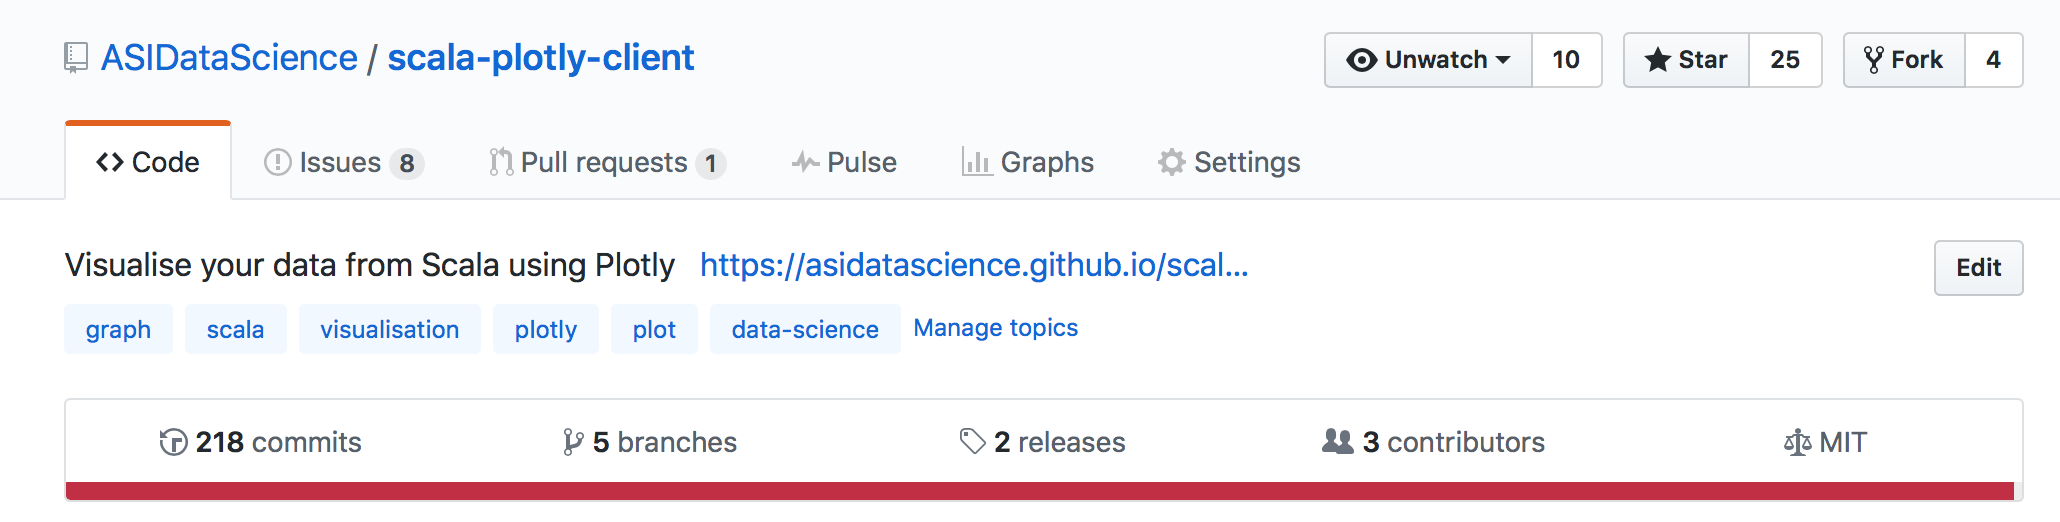
Become one of the cool kids on Github
Data analysis on open source repositories
Github is huge.
Github is huge.
- More than 35,000,000 repositories
- More than 1,750,000,000 commits
Github is huge.
- Linux
- jquery
- docker
- atom
- rails
- ...
But for every popular repository, there are hundreds of unsucessful ones
- 82% of repositories have zero stars
- 98% of repositories have ten stars or fewer
But for every popular repository, there are hundreds of thousands of unsucessful ones
But for every popular repository, there are hundreds of thousands of unsucessful ones
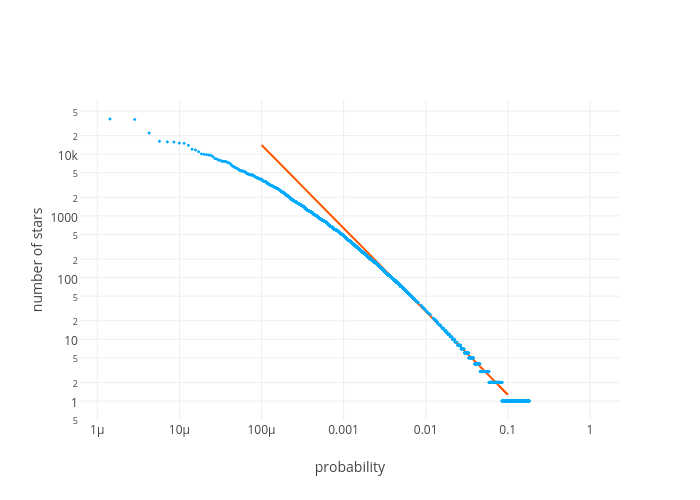
The top 28% of repositories hold 72% of the total stars
The top 28% of repositories hold 72% of the total stars
The distribution of stars has a Gini coefficient of 0.6
World income distribution Gini coefficient is 0.8
OECD income distribution Gini coefficients are 0.4-0.6
So why do some repositories become popular?
Become popular with four (not so easy) rules
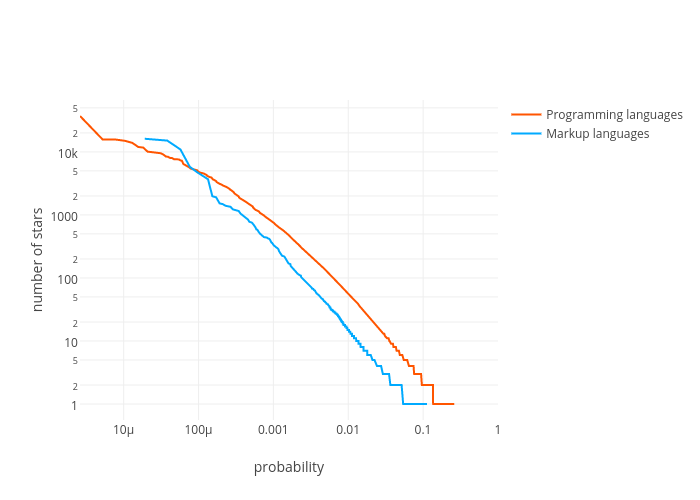
Rule #1: Make programs, not websites
Make programs, not websites
The 98th percentile repositories written in a:
- programming language have 19 stars
- markup language have 4 stars
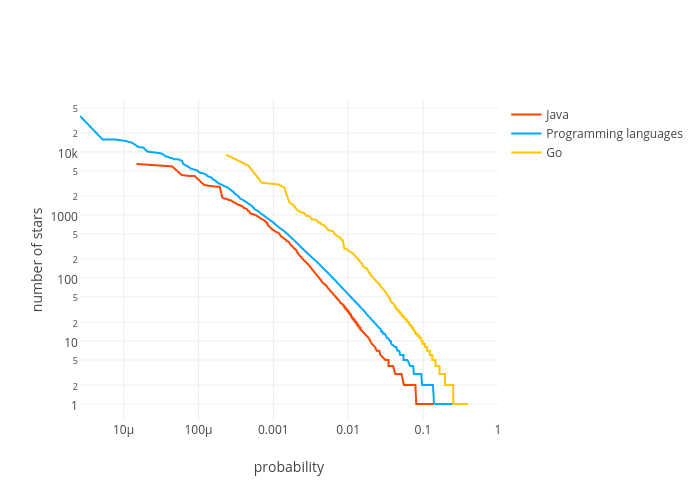
Rule #2: Choose a trending language
If I'm in the top 2% of repos for language X, I have Y stars:
| Language | # stars |
|---|---|
| Go | 93.1 |
| Scala | 36.6 |
| JS | 22.4 |
| Average | 19.4 |
| Language | # stars |
|---|---|
| Python | 19.3 |
| C++ | 19.1 |
| PHP | 17.7 |
| Ruby | 15.8 |
| C# | 12.8 |
| Java | 10.2 |
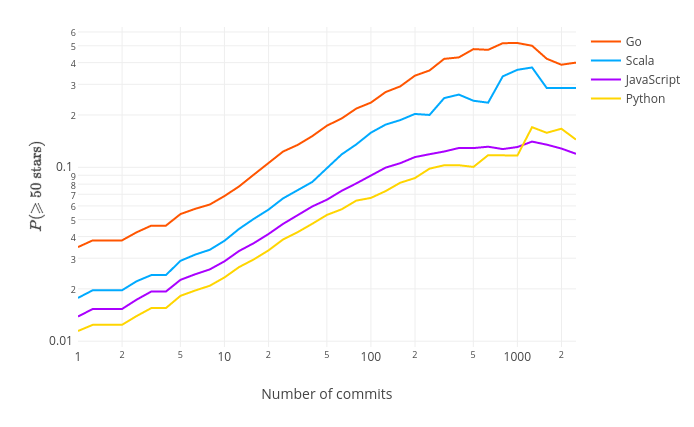
Rule #3: hard work pays off
Rule #3: hard work pays off
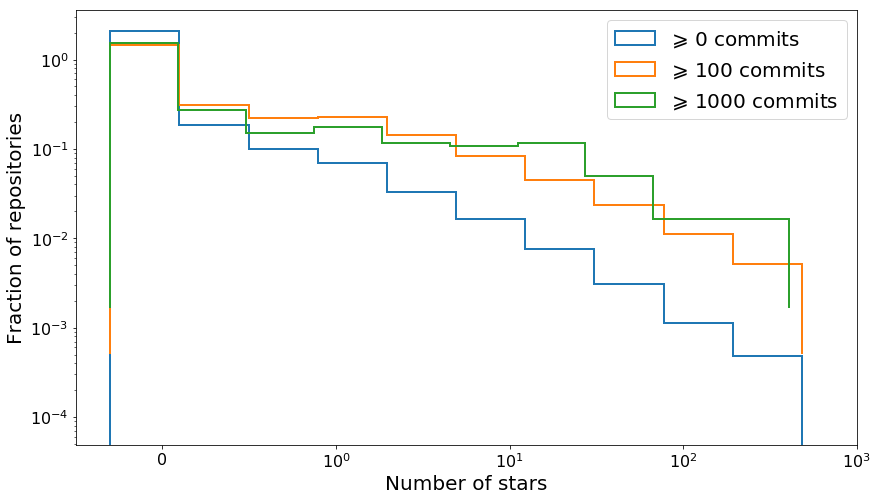
For repos of at least 1000 commits written in...
| Language | P( $\geqslant$ 50 stars) |
|---|---|
| Go | 52% |
| Scala | 36% |
| JavaScript | 13% |
| Python | 12% |
But some languages provide better ROI
Rule #4: Make it approachable
Make it approachable
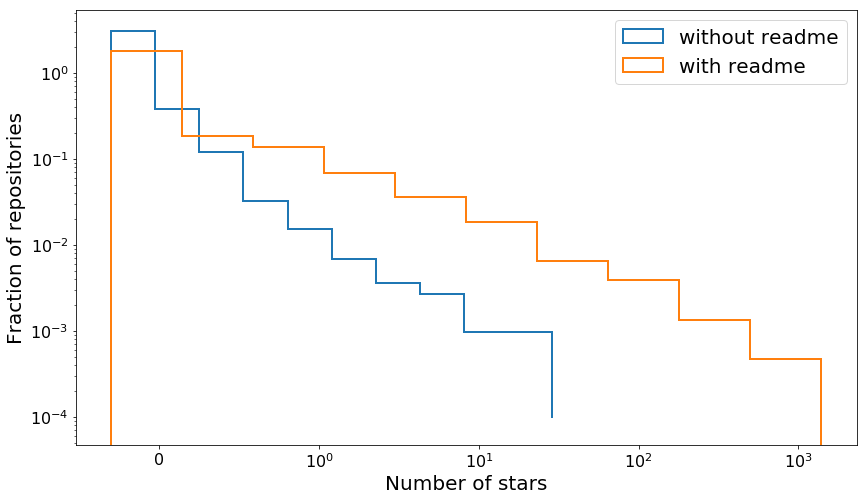
- Websites don't get stars
- Choose a trending language
- Work really hard
- Make it approachable
Making this presentation
- Data engineering parts done in Scala with Akka streams
- Initial data exploration in Python
- Plots and automated pipelines in Scala with scala-plotly-client
- Slides in reveal.js
Making this presentation
Built with 